
There’s been a lot of chatter lately (particularly from whole life producers) about the effectiveness of AG 49. Most of the talk is centered around the question: Are IUL max illustrated rates still too high?
As an actuary who’s designed life insurance products, I can answer: No. IUL illustrated rates are a good representation of potential product performance. Let me show you why.
First, a disclaimer: Like any financial or insurance product, future projections are just that – projections. Obviously, we can’t know what the future holds for the market, caps or any other features.
But with this in mind, let’s look at a few reasons IUL max illustrated rates do a good job projecting potential future experience.
- Insurance indexing relies on the market, but it’s not investment in the market. That’s important to remember, so we evaluate indexing’s potential returns based on its unique return pattern. By eliminating down years with a 0% floor and capturing a portion of the market’s rise in good years, indexing follows a different set of return rules than “investment” strategies.
Let me offer up two examples that drive this point home.
First, let’s look at index experience since IUL was introduced back in 1997. I looked at the average index returns for a hypothetical index with a floor of 0% and a cap of 12.5%. Here are the results from several 10-year periods (taken at 3-years intervals): 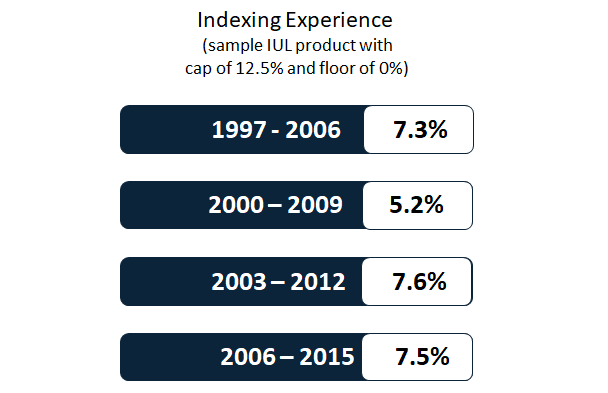
Do those numbers look familiar? They’re pretty close to today’s max illustrated rates on many products. If future performance mirrors past performance, max illustrated rates are right where they should be.
The second example deals with the outlier in the chart above. Let’s look at 2000-2009, the “lost decade” of investing. The market, on average, returned -1% a year. An index with a floor of 0% and a cap of 12.5% credited an average of 5.3%. As you can see, a devastating period in the market did not have a devastating effect on indexing. So even if future markets underperform, max illustrated rates are still within a reasonable range.
The bottom line? Projections for indexing vary greatly from projections for the market or other strategies, and today’s rates are in line with experts’ reasonable assumptions about the future.
- Much criticism of IUL max illustrated rates comes from whole life producers – which is to be expected. After all, in many cases consumers and advisors are choosing IUL over whole life. Many of these arguments center around the belief that IUL credited rates should average about the same as the fixed interest rate imbedded in a whole life dividend calculation. But this argument is simply wrong: The IUL policyholder is giving up the certainty of a fixed rate for the more volatile indexed rate. Theoretically, the more volatility, the higher the expected or mean rate should be.
- Finally, it’s worth remembering the committee that developed AG 49 was comprised of regulators, representatives from insurers selling IUL and representatives from insurers selling dividend paying Whole Life. The resulting regulation was considered with input from all groups. I believe we’ll see this regulation stand the test of time.
Thoughts? Insights? Want to learn more about tax-free income strategies using IUL? Let's talk.